Outline
Last update: November 2025
The new Food Import Vulnerability Index (FIVI) facilitates a rapid assessment of the risk to national food security of international food price shocks for 182 countries. Commodity-level FIVI scores indicate the vulnerability of a country to higher world prices for each staple food, while a country’s FIVI measures the vulnerability of the country to higher world food prices in general. Both the commodity-level FIVI and the national FIVI are based on the following three components:
- Share of caloric food intake, calculated as the share of staple crops in total food-energy consumption measured in calorie intake.
- Import dependence ratio, which is the share of net imports of each staple food in total domestic food consumption of the commodity.
- Prevalence of food insecurity, defined as the share of the population that faces moderate or severe food insecurity according to the Food Insecurity Experience Scale (FIES)
The commodity-level Food Import Vulnerability Index (FIVI) is calculated as the geometric mean of the three components listed above for each staple food and each country. The commodity-level FIVI is calculated for the 15 most important staple foods: wheat, rice, maize, sorghum, millet, cassava, yams, potatoes, sweet potatoes, plantains, beans, groundnuts, soybeans, sugar, and vegetable oils. ...
Please note that if a country is a net exporter of the commodity, the food import dependence is considered zero for the purpose of calculating the FIVI, resulting in a vulnerability index of zero for that commodity.
The country FIVI combines the commodity-level FIVIs for the 15 staple foods into one national index. More specifically, it is calculated as the geometric mean of the share of staple calories that are imported and the share of the population that is moderately or severely food insecure. The former is calculated as the weighted average of import dependence of the 15 staple foods, where the weights are the contribution of the commodity to caloric intake in the country. More information on the data sources and methods can be found in the Methods section.
The rationale behind using a multiplicative index is to ensure that the FIVI = 0 if there is a) zero caloric intake from the food commodity, b) the commodity is not imported, or c) none of the population is food insecure. For the FIVI score to be 100, the commodity would need to account for all of the caloric intake, all domestic supply of the commodity would need to come from imports, and the entire population would need to experience moderate or severe food insecurity. These are the extremes. In practice, the national FIVI ranges between 1 and 84, with the highest value found for Yemen.
In addition to major staple crops like maize, wheat, rice, and sorghum, the Food Import Vulnerability Index (FIVI) also incorporates metrics on lesser-traded consumer products that nevertheless contribute significantly to caloric intake in vulnerable countries. Specifically, cassava, plantains, yams, and millet have been included in the index calculations. These commodities account for at least 15% of caloric intake in 10 out of the 26 countries where the Prevalence of Undernourishment (PoU) is equal to or greater than 20%, and where moderate food insecurity impacts at least 59% of the population. In scenarios of external shocks affecting food security, these lesser-traded staples serve as important substitutes and should be integrated into policy considerations.
A dashboard with world maps, table and methodology can be found for each indicator by clicking on the tabs below.
1. Share of caloric intakes
Overview
All 15 staple foods: The distribution of staple crops is not uniform across the globe. Low- and middle-income countries tend to rely more heavily on staple crops, emphasizing their importance in these regions. This map shows the combined share of caloric intake coming from all 15 commodities across the world. These products account for at least 30% of the calorie intake of different countries.
Main 3 staple foods: These commodities can vary based on regional dietary preferences and food availability. In a global context, wheat, rice, and maize emerge as the dominant staples.
Wheat: Wheat is predominantly consumed in the Middle East and Central Asia, with Afghanistan leading the way, where it accounts for a substantial 61.5% of daily caloric intake. Turkmenistan closely follows at 50.7% while the Central African Republic 1.55% and DR Congo (1.64%) are the countries where it is consumed the least.
Rice: Rice holds primary staple status in Asia and certain parts of Africa. Bangladesh stands out as the most rice-dependent country, with a staggering 66.4% of its caloric intake originating from rice.
Maize: Maize is a predominant staple in East and South Africa, as well as in Mexico and Central America. Malawi leads the world, with maize contributing to 47.9% of daily calorie intake.
Sorghum: The caloric intake of sorghum is predominant in Africa. Especially in South Sudan and Sudan where this commodity contributing to 23% and 20.7% of their caloric intake, respectively.
Millet: Millet takes precedence in Niger, where it constitutes 27.8% of daily caloric intake.
Plantain: Sub-Saharan countries are known for their reliance on plantains, with the Democratic Republic of Congo being a notable example, boasting the highest share of caloric intake attributed to plantains.
Beans: In terms of caloric intake, beans represent less than 15% of intake in all the countries covered by the analysis. In fact, bean contribute more than 10% of caloric intake in only two countries: Burundi (14.7%), and Rwanda (13.5%). In addition, in the top 10 countries for which the values of the caloric intake of beans are the highest we find six African countries (Burundi, Rwanda, Tanzania, Uganda, Kenya, and Cameroon) and three from Central America (Honduras, Salvador, and Nicaragua).
Groundnuts: Groundnuts do not constitute a major food in the nutritional structure of any of the countries covered by the analysis. The top 10 countries in terms of the caloric contribution are all African countries. West African countries are particularly represented. In the Gambia, groundnuts represent 7.4% of the diet, followed by Niger, Senegal, Guinea and Nigeria.
Soybeans: The contribution of soybeans to the caloric intake is quite modest. In fact, it only represents 3.5% in Japan, where its contribution is highest. Eight of the top 10 countries in terms of the importance of soybeans are in Asia.
Cassava: Cassava serves as a primary caloric source in several sub-Saharan countries, underlining its significance in local diets.
Yams: Yams represent a relatively low share of caloric intake on a global scale, with limited consumption in comparison to other staples.
Potatoes: Potatoes contribute less than 10% of the caloric intake in every country in the analysis. They are relatively important in Eastern Europe (e.g. Belarus and Ukraine), Central Asia (e.g. Kyrgyzstan and Kazakhstan), the Andean countries (e.g. Peru and Bolivia), and highland areas of sub-Saharan Africa (e.g. Rwanda and Lesotho).
Sweet potatoes: Sweet potatoes represent between 10 and 20% of caloric intake in the Solomon Islands, Burundi and Rwanda. The rest of the top 10 countries are African countries, where the contribution of sweet potatoes to caloric intake ranges between 3% and 9%.
Plantains: Uganda has the highest share of caloric intake coming from plantains, although it's not a common staple in the rest of the world.
Vegetable oil: Spain, Greece, and the United Arab Emirates are top consumers of vegetable oil, significantly contributing to their caloric intake.
Sugar: Sugar is one of the products for which we observe a fairly homogeneous contribution to caloric intake. Indeed, for all countries we observe that it represents less than 20% of caloric intake. Among the 10 countries where sugar makes a relatively high contribution, only Guatemala, Barbados, Kiribati, Gambia, Saint Lucia and Trinidad have an index above 15%.

Cci = the average calories consumed per person per day in country c from commodity i
Σj Ccj = the sum of calories consumed per person per day in country c across all j commodities, where j represents one of the 90 food products in the FAO database.
The 15 staple foods included in the index are wheat, rice, maize, sorghum, millet, cassava, sweet potatoes, yams, plantains, beans, groundnuts, soybeans, sugar, and vegetable oil. In the FAO database, the cereals, cassava, and potatoes include products made from the staple crop such as wheat bread and cassava flour. Vegetable oil is an aggregated category that includes 13 types of oil in the original FAO database. In theory, the caloric share for each commodity can vary between 0 and 100 percent, but in practice it is rarely greater than 50 percent.
Download content here
2. Import dependence ratio
Overview
All 15 staple foods: All products combined, there is a concentration of the most dependent imports countries in Africa. Indeed, more than a dozen of the countries in the continent have a high index (above 50%). In the African continent, the most vulnerable countries are Djibouti (99.06%), Mauritius (94.80%).
Main 3 staple foods: Regarding wheat, maize and rice, four countries appear to be the most vulnerable because of their status as net importers (Djibouti, Oman, Bahrain and Iceland), while 22 countries are self-sufficient. Africa remains the continent with the highest number of import-vulnerable countries.
Wheat: Wheat is a widely traded commodity across 183 countries. Among them, 26 countries serve as net exporters, meeting 100% of the consumption needs for 63 other countries. The remaining countries exhibit varying degrees of dependence on wheat imports, ranging from 4% to 99.9%.
Rice: Rice is heavily imported in numerous regions, including Europe, Africa, Canada, and Australia. Among 159 countries that import rice, 45% of them are entirely dependent on imports for their rice supply.
Maize: Maize is traded in 168 countries, with notable import reliance in the Middle East, West South America, North Europe, and parts of South Africa. Of these, 18% of countries are responsible for meeting the needs of the rest of the world.
Sorghum: Sorghum is primarily imported in China, Canada, Central Asia, and parts of Europe. Seventeen countries exhibit 100% reliance on sorghum imports.
Millet: Millet is imported in 53 countries, with 33 of them being entirely dependent on imports. Seventeen countries are net exporters of millet.
Beans: The index shows that there are around twenty net exporting countries with a heterogeneous distribution across continents (e.g., Canada, the United States, Argentina, South Africa, and Australia). Conversely, around forty countries are net importers. Some countries import all of their domestic requirements, including Afghanistan, Libya, Uzbekistan, Nigeria, and Vietnam. They are therefore particularly vulnerable to potential price increases. In addition, self-sufficient countries are mainly located in Africa (e.g., Mali, Gabon, Ghana, Benin, Togo, and Zambia).
Groundnuts: Net exporters are concentrated in the Americas (e.g., the United States, Brazil, Argentina, and Bolivia) and Africa (e.g., Senegal, Sudan, Ethiopia, and Tanzania), as well as several countries in Asia. Conversely, countries with a high and very high level of dependency are mainly located in Europe, Central Asia, and southwest Asia. Finally, the countries that self-sufficient in groundnuts are mainly located in Africa.
Soybeans: Thirty-six countries import all their soybean needs, while another 40 rely on imports for over half of their requirements. Although they are distributed across all continents, we observe a concentration in Europe (e.g., Germany, Spain, and Scandinavia), Asia (e.g., China, Mongolia, and Indonesia) and in South America (e.g., Mexico, Colombia, and Peru). Most countries in Africa are self-sufficient in soybeans, meaning they have little or no imports and exports. Major exporters include the United States, Canada, Brazil, and Ukraine.
Cassava: Cassava is a key imported commodity in North America, Asia, Europe, and Australia. Forty countries entirely depend on cassava imports.
Yams: Twenty-two countries import yams, with 21 of them being 100% reliant on imports. In contrast, 10 countries are net exporters of yams.
Potatoes: Across all the countries covered in this analysis, we generally observe low import dependence, indicating that potatoes are not widely traded. Indeed, the number of self-sufficient or very weakly dependent countries dominates. The few most dependent countries with an import dependence ratio greater than 50% are located in southern Africa (Botswana, Namibia, and Eswatini), in West Africa (e.g., Benin, Togo, Senegal, Cote d’Ivoire, and Senegal), in South America (e.g., Paraguay and Suriname), and southeast Asia (e.g., Cambodia, Malaysia, and Thailand).
Sweet Potatoes: Sweet potatoes are rarely traded internationally. All or almost all of South America, Africa, and Asia are self-sufficient in sweet potatoes, meaning that they import or export less than 5% of their domestic requirements. Exporters include the United States, Mexico, Egypt, and South Africa. Although Canada, western Europe, and Russia are shown as highly dependent on imports, in fact, their consumption of sweet potatoes is very low.
Plantains: Among the 64 countries that import plantains, 59 rely on imports for 100% of their needs. Thirteen countries, including Ecuador and Myanmar, serve as notable net exporters of plantains.
Vegetable oil: Central and South Asia, the Middle East, many African countries, and parts of West South America significantly rely on vegetable oil imports. A total of 25 countries imports 100% of their vegetable oil needs.
Sugar: In Latin America, most countries are exporters, but in Africa, most are heavily dependent on sugar imports. Only six African countries are exporters (South Africa, Zimbabwe, Zambia, Zambia, Malawi, and Egypt), and a handful are self-sufficient or weakly dependent. In Asia, Russia, India, and Thailand are among the few exporters, while southwest Asia, Central Asia, and southeast Asia are heavily dependent on sugar imports. In Europe, sugar beet production allows some northern European countries to export sugar, while southern European countries are heavy importers.
The import dependency ratio is calculated as follows:

Data source for this analysis
The contribution of each commodity to the caloric intake in each country is calculated using the Food Balance Sheets calculated by the Food and Agriculture Organization . These data are available on an annual basis for 182 countries. The most recent data are for 2020. We calculate the total caloric intake and then the contribution of four commodities: wheat, maize, rice, and sorghum. In each case, the commodities include calories consumed from grain products. For example, “wheat and products” includes consumption of wheat, flour, bread, and other wheat products.3. Prevalence of food insecurity
Overview
This map provides a visual representation of the share of the population experiencing moderate to severe food insecurity in various countries. The data indicates that a significant number of countries in Africa exhibit a very high population share experiencing food insecurity. South Asia, Central and South America follow closely in the number of countries with high food insecurity rates.
To fill this gap, we use interpolated values based on regression estimates of moderate and severe food insecurity as a function of per capita gross domestic product (purchasing power parity, 2017 international US dollars), the FAO Prevalence of Undernourishment, the Gini coefficient, and the headcount poverty rate (FAO and World Bank). To get estimates of food insecurity, we use as many of these proxy indicators as are available for the country in question, resulting in the use of seven regression models with different combinations of these indicators. All models use linear and quadratic versions of the explanatory variables. These models can explain most of the variance in the food insecurity rate, with values of R2 between 0.61 and 0.81. The 41 countries for which is was necessary to interpolate MFI values are Burundi, Bahrain, Belarus, Bolivia, Bhutan, China, Colombia, Cuba, Cyprus, Dominica, Dominican Republic, Micronesia, Gabon, Guyana, India, Iraq, Saint Lucia, Mali, New Caledonia, Niger, Nicaragua, Nauru, Oman, Panama, Papua New Guinea, North Korea, French Polynesia, Qatar, Rwanda, Saudi Arabia, Solomon Islands, Seychelles, Syrian Arab Republic, Chad, Tajikistan, Turkmenistan, Timor-Leste, Turkey, Taiwan, Venezuela, and Yemen.
More information on the data and methods, including the interpolation procedure and sensitivity analysis, is available from Minot, N. et al. (2023). How vulnerable are countries to higher food prices? A new approach. Washington, DC: International Food Policy Research Institute.
Data source for this analysis
These data are based on household surveys using the Food Insecurity Experience Scale (FIES). To fill this gap, we use interpolated values based on regression estimates of moderate and severe food insecurity as a function of per capita gross domestic product, the FAO Prevalence of Undernourishment, the Gini coefficient , and the headcount poverty rate.Download content here
Food Import Vulnerability Index (FIVI)
Overview
All 15 staple foods: The national Food Import Vulnerability Index (FIVI) is calculated as the geometric mean of two components: the share of calories from the 15 staple foods that are imported and the share of the population experiencing food insecurity. According to the national FIVI, the countries most vulnerable to higher world prices of staple foods are Yemen (with a score of 84) and Haiti (76), followed by Eswatini, Botswana, and Comoros (all three at 71). In contrast, Argentina, Russia, and Paraguay stand out as the least vulnerable.
Wheat: Yemen remains the most vulnerable country regarding wheat, with an index value of 70, followed by Afghanistan and Djibouti with values of 54. Importance of wheat in Yemen's caloric needs (46%) and its status as a near-net importer explains this ranking.
Rice: The most vulnerable countries regarding rice are Liberia, Gambia, and Guinea-Bissau, with index values of 61, 59, and 59, respectively.
Maize: Due to a high dependence on imports (with a rate of more than 70%) Zimbabwe, Lesotho, and Eswatini are the most vulnerable countries regarding maize price hikes.
Sorghum: South Sudan, Rwanda, and Eswatini represent the most vulnerable countries to sorghum price increases.
Millet: Nineteen countries are marked as vulnerable to millet price increases, with index values ranging from 1.7 to 8.5, reflecting a low caloric share and limited trade for millet.
Beans: In general, we observe low vulnerability in all the countries covered due to the low caloric contribution of the product on the one hand and the low level of dependence on imports on the other. Only two countries qualify as having low vulnerability to higher world prices in beans: El Salvador and Venezuela. No country qualifies as having medium, high, or very high vulnerability.
Groundnuts: Vulnerability to external shocks for this product is relatively low due to low caloric intake and low dependence on imports. Numerous countries in sub-Saharan Africa are not vulnerable to higher groundnut prices because they are exporters. This includes countries in the Sahel, Horn of Africa, and southeastern Africa.
Soybeans: Due to low caloric intake and low dependence on imports, the vulnerability to higher soybean prices is relatively low. The highest FIVI scores are in Timor-Leste, Taiwan, and Thailand, though even these scores are less than 20, placing them in the category of very low vulnerability. China is the largest importer of soybeans in the world, importing more than 80% of its requirements, but its FIVI score is low because soybeans play a minor role in the diet and food insecurity is not widespread.
Yams: Sixteen countries are identified as vulnerable to yam price increases, with small index values ranging from 0.5 to 5.2.
Cassava: Given the small share of cassava in caloric intake, only Rwanda and Laos have FIVI values higher than 20, reflecting lower vulnerability to price shocks for cassava worldwide.
Potatoes: Across the countries covered by the index, there is generally a low vulnerability to higher prices of potatoes. The country most vulnerable is Barbados, for which the FIVI score is just 20. All other countries have very low or negligible vulnerability or they export potatoes.
Sweet potatoes: All countries are have negligible vulnerability in sweet potatoes or export the product. This reflects the fact that sweet potatoes are not widely traded and/or are not an important source of calories. The most vulnerable country is Mauritania, though its FIVI score is just 7.4, indicating negligible vulnerability.
Vegetable oil: Congo, Zimbabwe, and Yemen are identified as the most vulnerable countries despite the relatively small share of caloric intake from vegetable oil in their diets.
Sugar: Four countries are classified as having high vulnerability to spikes in international sugar prices: the Gambia, Yemen, Haiti, and Djibouti. Another 29 countries are considered to have medium vulnerability. African countries affected by medium vulnerability are Libya, Botswana, Namibia, Sudan, South Sudan, Guinea, and Mauritania. In South America, Venezuela and Suriname are in the medium vulnerability category. Finally, in Asia, Afghanistan, Iraq and Syria are in the same situation.
Plantains: The number of vulnerable countries to plantain price rises reaches 48, with index values ranging from 0.5 to 15.5, highlighting a low degree of vulnerability.
- the share of calories that the food commodity represents in the national diet,
- the share of national consumption of the commodity that comes from imports, and
- the share of the population experiencing moderate or severe food insecurity
The commodity-level FIVI is calculated at the country-commodity level using the following expression: :
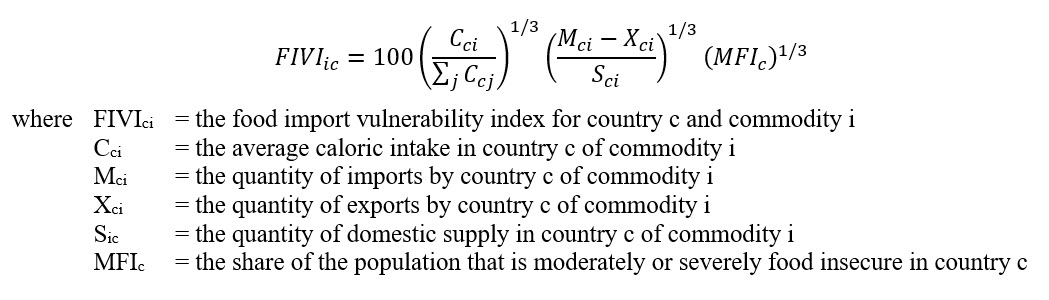
Although index i refers to the 15 staple foods, index j refers to all 90 food commodities in the FAO database. Thus, the caloric share for each staple food is the proportion of total caloric intake. In the case of exporters, the import dependency ratio is negative. Since negative numbers cannot be raised to a fractional power, we set the value of FIVI to zero. This is consistent with the fact that an exporter of a given commodity is not vulnerable to increased world prices of the commodity.
The rational for using a multiplicative index is that the vulnerability should be zero if a) the commodity does not play a role in the local diet, b) domestic consumption is based entirely on domestic production without relying on imports, or c) there is no food insecurity in the country. The base index uses equal weights for the three components, but we carry out sensitivity analysis to determine whether the index and rankings are affected by applying different weights to the three components.
The national Food Import Vulnerability Index (FIVI) is calculated as follows:
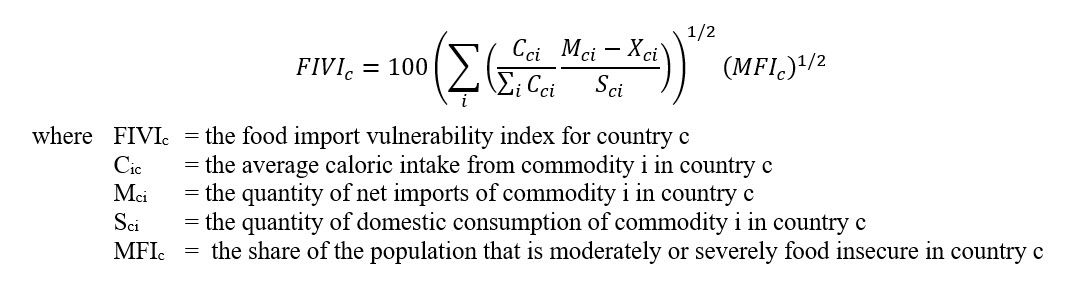
The first term in parentheses is the weighted average of the import dependence ratio ((Mci-Xci)/Sci) across the 15 staple commodities, where the weights are the caloric contribution of each commodity to total staple calories in that country (Cic/ΣCic). Note that, unlike the calculation for the commodity-level FIVI, the summation in the denominator is limited to the 15 staple foods. As above, if the country exports a commodity, the import dependency ratio is set to zero for that commodity, reflecting the fact that it is not vulnerable to higher world prices of that commodity. The weighted average of the import shares for each commodity is equal to the share of the calories from the 15 staple foods that is imported. The second term is the share of the population that is moderately or severely food insecure (MFIc)
The national FIVI will be low if imports represent a small share of the calories consumed from the 15 staple foods or the share of the population experiencing moderate or severe food insecurity is low. Conversely, the national FIVI will be high if a large share of the calories consumed of the 15 staple foods is imported and a large proportion of the population is moderately or severely food insecure.
More information on the data and methods, including the interpolation procedure and sensitivity analysis, is available from Minot, N. et al. (2023). How vulnerable are countries to higher food prices? A new approach. Washington, DC: International Food Policy Research Institute.
Data source for this analysis
The contribution of each commodity to the caloric intake in each country is calculated using the Food Balance Sheets calculated by the Food and Agriculture Organization . These data are available on an annual basis for 182 countries. The most recent data are for 2020. We calculate the total caloric intake and then the contribution of four commodities: wheat, maize, rice, and sorghum. In each case, the commodities include calories consumed from grain products. For example, “wheat and products” includes consumption of wheat, flour, bread, and other wheat products.Download content here
The previous version
The previous tool effectively served to identify early on exposure to the shocks to global food and fertilizer markets caused by the war in Ukraine that started in February 2022.
Please explore the Vulnerability to Global Market Shocks V.1: Wheat and Fertilizer Price Shocks Caused by Ukraine Crisis tool by clicking the link below