Outline
The dashboard tracks global fertilizer market trends, price drivers, trade, and production, helping users monitor risks and understand impacts on food systems.
Last update: July 3, 2026 | Next update: August 7, 2026
The Fertilizer Market Dashboard provides you several ways to monitor the latest developments in fertilizer markets, including a summary of market developments and tools for tracking fertilizer trade, utilization, and production.
The dashboard
Fertilizer market analysis by IFPRI & FSP
Here you can find a selection of IFPRI and FSP analysis on fertilizer markets.

Underlying data
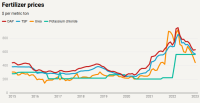
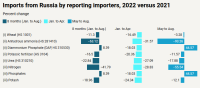
Fertilizer price data come from the the World Bank's "Pink Sheet." Trade, use, and production data come from FAOSTAT.
Acknowledgments
United States Agency for International Development (USAID)
The United States Agency for International Development (USAID) contributed initial funding for the development of the tool by the Food Security Portal (FSP) in 2022. Subsequent updates and ongoing maintenance of the tool by the FSP is funded by the European Union.
The Foreign, Commonwealth & Development Office (FCDO) of the United Kingdom
The Foreign, Commonwealth & Development Office (FCDO) of the Government of the United Kingdom contributed initial funding for the development of the tool by the Food Security Portal (FSP) in 2022. Subsequent updates and ongoing maintenance of the tool by the FSP is funded by the European Union.
We appreciate any feedback you care to share with us.