The “Liberation Day” tariffs proposed by the United States on April 2 included a blanket 10% increase for countries with which the U.S. runs bilateral trade surpluses or small deficits, and a range of higher tariffs for 56 economies with which the U.S. runs sizeable trade deficits (excluding Canada and Mexico as partners in the U.S-Canada-Mexico free trade agreement; and Cuba, Russia and North Korea).
The proposal specified tariffs by country rather than by product and many potential effects of these measures on individual commodities and industries appear to have been overlooked. If we want to understand the potential trade and economic impacts of these measures we need to know more about their likely effects on individual products and industries. IFPRI researchers have analyzed possible impacts of the tariff proposals on global agrifood trade; of the China-focused tariffs on soybean and other oilseed markets; and on agrifood trade in sub-Saharan Africa. This analysis takes a broader look across the range of both agrifood and non-food-related commodities and breaks down impacts by product.
To estimate the average impact of these tariff increases by commodity, the analysis weights them by the level of exports from these countries to the U.S. in 2023 (Figure 1). The analysis addresses the April “reciprocal” tariff increases, recognizing that the 10% tariff increases remain in effect, while the additional country-specific increases were suspended until July 9 and, with some modifications, recently deferred until August 1.
Uneven impacts across products
One striking observation from the analysis is that the increases vary substantially across standard product groups. While the average rise is 23 percentage points, certain products see considerably larger increases. For instance, tariffs on footwear would rise by an average of 34%, clothing by 31%, and the combined textiles and clothing category by 30%. The broad machinery and electrical category, which encompasses vital products such as semiconductors, is slated for a 27% tariff increase. In contrast, tariffs on fuels are expected to increase by 16%, while tariffs on agrifood goods such as animal products, vegetable products, and processed food products would see the smallest increases, 16%-17%.
Figure 1
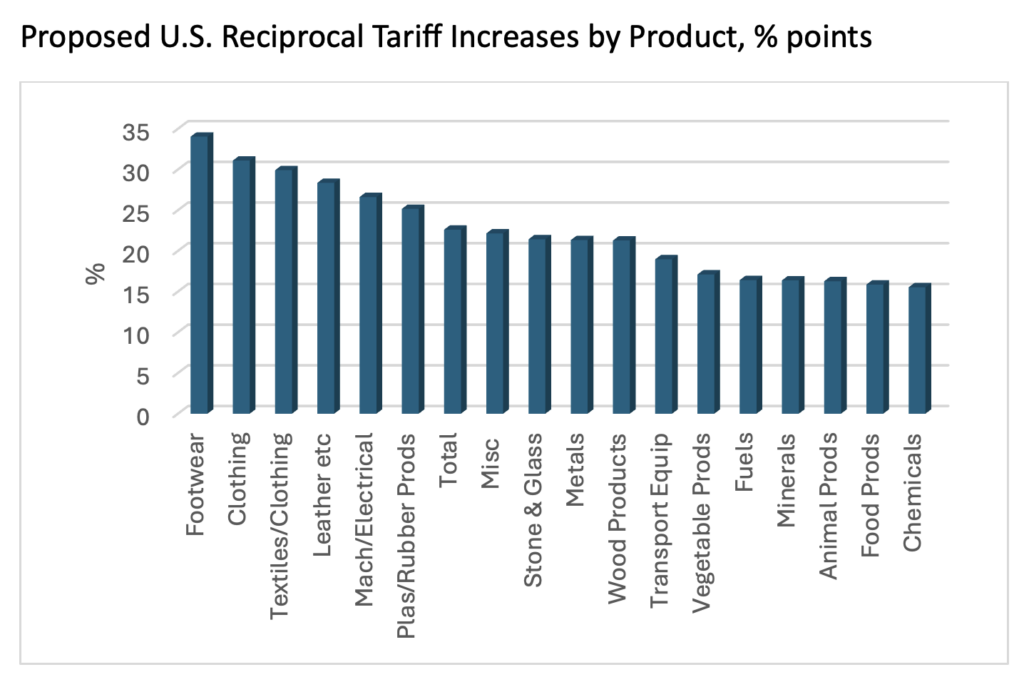
Source: Author
These substantial tariff increases on footwear and clothing are particularly noteworthy, given the high volume of such U.S. imports and low levels of domestic clothing and footwear manufacturing—and policymakers’ stated aim of focusing U.S. manufacturing growth on high-technology products rather than goods such as sneakers and T-shirts.
Comparative advantage and tariff increases
One potential explanation for the observed uneven impact by commodity—in addition to any differences in trade policy—could be comparative advantage. Might countries with stronger comparative advantage in particular products like footwear or clothing relative to the U.S. have larger bilateral trade surpluses and hence face higher “reciprocal” tariffs? Conversely, might countries that excel in sectors like agriculture, where the U.S. is strong, tend to have lower bilateral trade surpluses (or deficits) and hence experience relatively low tariff increases?
A simple way to assess the importance of this effect is to compare the tariff rate increases with the simple and transparent Revealed Comparative Advantage (RCA) measure that compares the share of each product in U.S. exports with its global export share. Figure 2 plots the RCA, estimated using 2023 trade data, against the proposed average tariff increases.
Figure 2
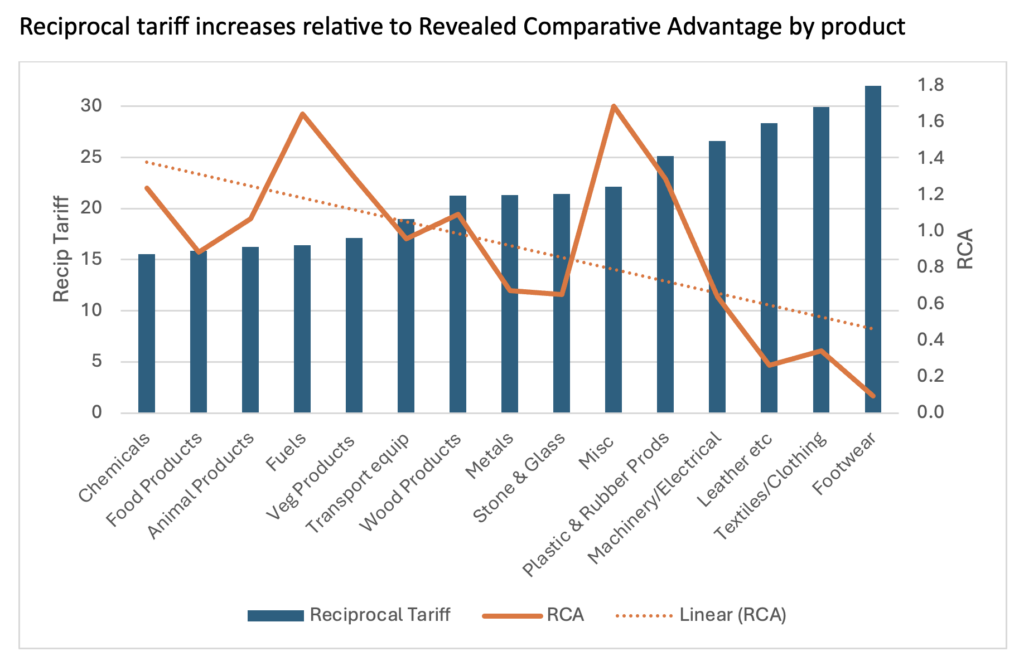
As anticipated, the graph—and particularly the linear trend line— reveals an apparent inverse relationship between comparative advantage and the reciprocal tariff rates. Most products where the U.S. has a strong comparative advantage—such as animal, vegetable, and food products, and fuels—face low reciprocal tariff increases. By contrast, products such as clothing and footwear where the U.S. has a comparative disadvantage, and hence an RCA well below 1, generally see larger tariff increases. Leaving out minerals, where the U.S. has a much higher share of production than of exports, as in Figure 2, the correlation between the two measures is -0.71. The alignment of the tariffs with U.S. comparative disadvantage seems likely to raise the costs of the proposed tariff increases for both the United States and its trading partners.
Potential policy implications
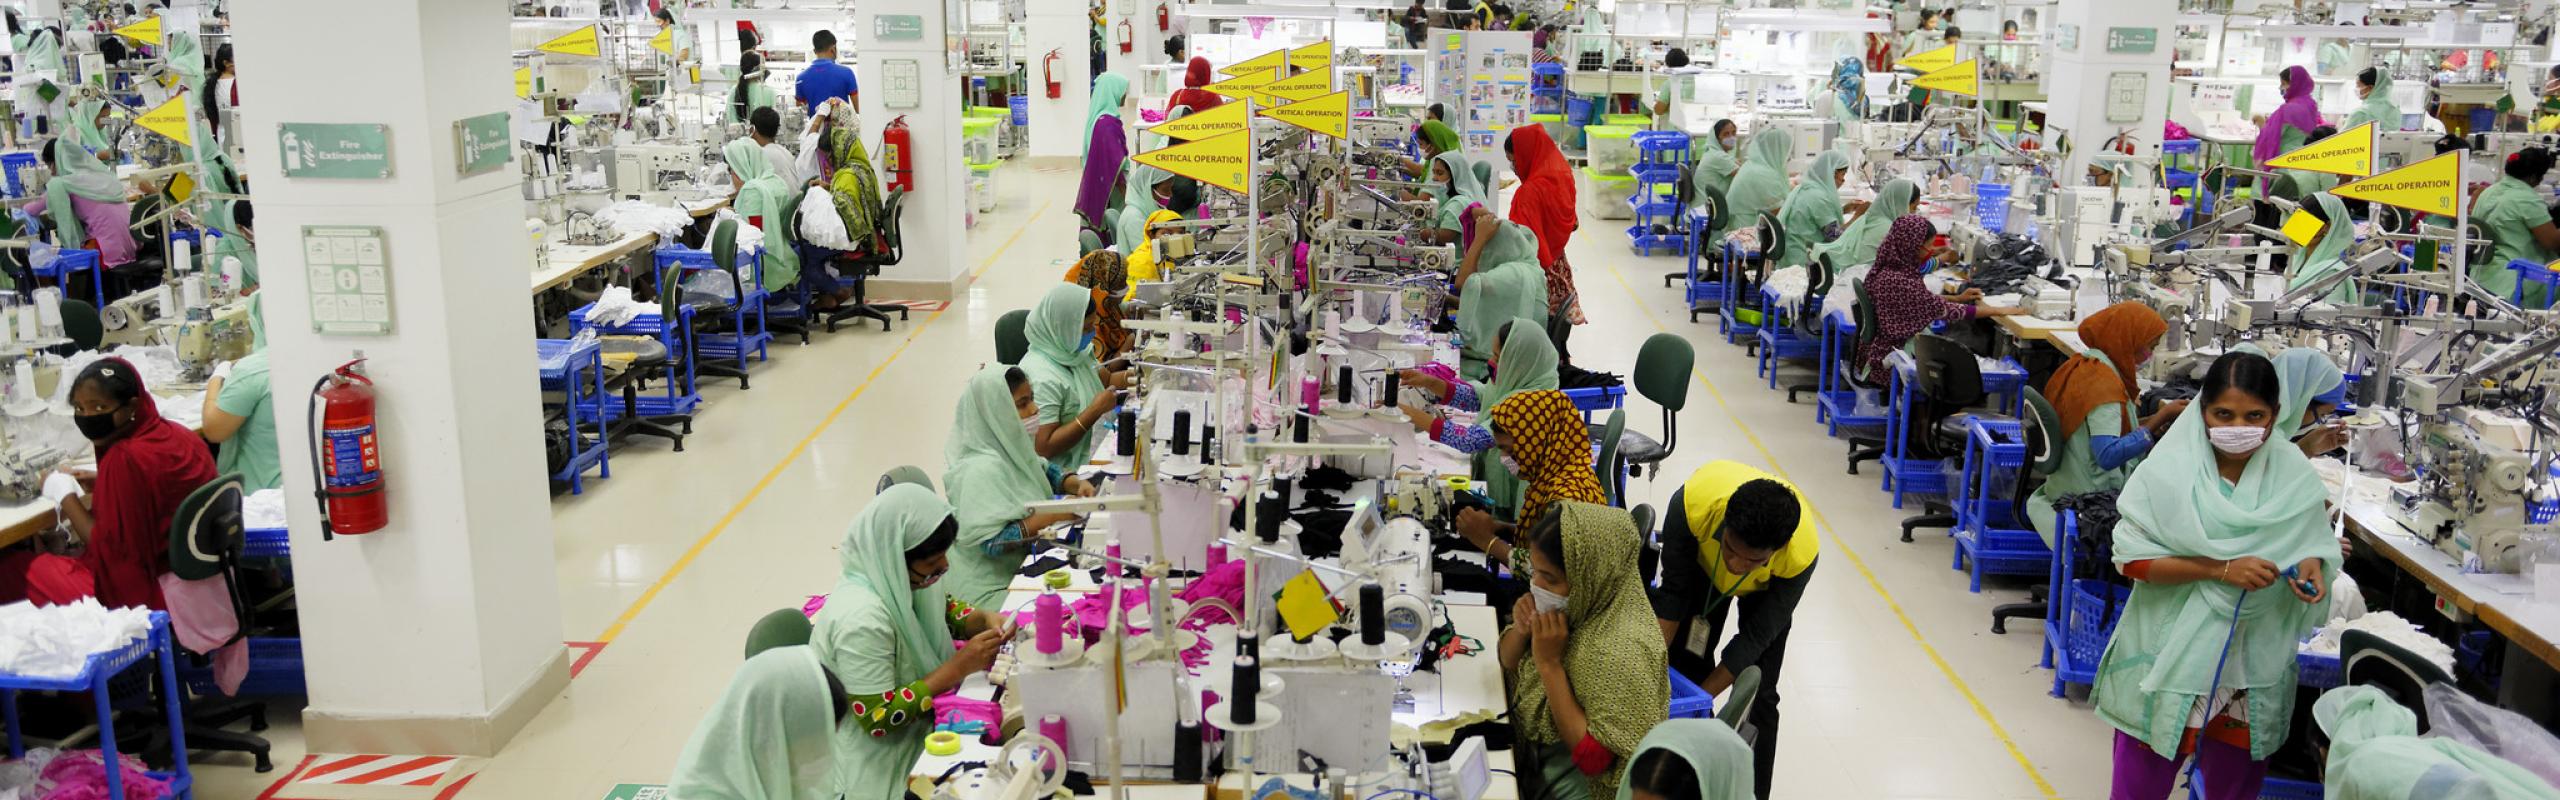
The apparent commodity bias in the U.S. “reciprocal” tariff proposal has several potential implications for trade negotiations about implementation of this proposal. The large “reciprocal” tariff increases on labor-intensive products such as footwear, clothing, and textiles seem likely to be serious concerns for the many low and middle income countries, such as Bangladesh and Cambodia, that have developed highly-efficient clothing sectors to serve the U.S. market. On the other side of the table, the domestic production incentives created by such large tariff increases appear to clash with the U.S. goal of expanding production of more sophisticated manufactures. A key challenge for negotiators seems likely to be to identify and implement adjustments that address the tensions between the proposed tariff increases and the underlying differences in countries’ competitiveness.
Will Martin is a Senior Research Fellow with IFPRI’s Markets, Trade, and Institutions Unit. Opinions are the author’s.