Outline
To understand how vulnerable a country is to food shortages, we must know how much of its food consumption comes from domestic production and how much comes from imports.
Depending on how much of a given country's imports come from another specific country, it may be important from the importer's perspective to know what the agronomic, economic, political, and logistics issues affecting the trade partner are. If a country meets a significant share of its consumption through imports, a country-to-country indicator of food trade dependence would help identify the true impacts of possible supply chain shocks from the trade partner. These short-term import supply shocks can come from droughts, abrupt trade policy changes, price volatility of crops, or other barriers to trade.
Our aim is to publish food trade dependence index data publicly for all stakeholders to understand the current dynamics of global agricultural trade by utilizing this index data. The index is calculated at a country-by-country spatial disaggregation in order to show the impact of possible abrupt supply shocks in a country that may be the main source of imports for other countries. If a significant share of imports of a country is dependent on one supplier, a possible supply constraint in the import source may negatively impact the food security situation in the importer country.
The food trade dependence index (country to country import share) is published on a monthly basis since our aim is to show on-time food trade dependence for the importer countries and for stakeholders.
The food trade dependence index (latest three-month average of country to country import share), defined as a 3-month average for the food trade dependence index for the latest three months, is also published in order to show the medium-term trends for the importer countries.
Regional Shares of Imports are also provided to show food trade dependence of a country on imports from a region. A regional import share for a crop will show the share of imports of reporter country coming from a region relative to the total imports of reporter country. Regional shares for all reporter countries are computed for Africa, Sub-Saharan Africa, Asia, Northern America, Latin America and the Caribbean, Oceania, Middle East and North Africa, and South Asia.
Trade patterns change over time in response to long-term dynamics such as available domestic supply, prices in the world markets, available supply in the global markets, and trade policy changes among other factors. For countries that are not food secure, any short-term shocks to domestic supply and to import availability from world markets would generate conditions that may make them more vulnerable. In this context, utilizing a food trade dependence index to identify the dependence of imports to a country that may go through supply shocks is important for stakeholders to identify vulnerabilities and to take precautions.
The Food Trade Dependence Index is defined as the import share of a country from an exporter country, on a monthly basis, for four crops: maize (1005), rice (1006), soybeans (1201), and wheat (1001).
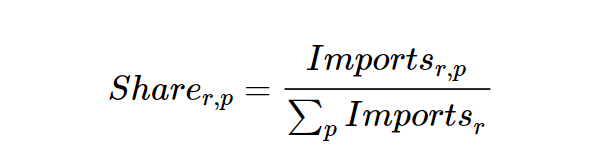
where r is reporter country for imports, p is partner country for source of imports, and Imports refer to import quantity.
Share refers to imports of each country from each partner relative to total imports of each country for the four crops.
The food trade dependence index (country to country import share)
Use cases
This section provides stories of how this Food Trade Dependence Index can interpret the significant events on international commodity markets.
1. China soybean imports in 2021
After slumping slightly last year, Chinese soybean imports increased in year 2021, according to a Global Agricultural Information Network report from the US Department of Agriculture. The increase is due to China’s growing soybean meal feed use, reduced soybean production and limited imports of rapeseed, according to the report. According to the Excessive Food Price Variability Early Warning System in the Food Security Portal, soybeans remains the low price volatility in June 2021. Based on the world supply-demand outlook from AMIS market monitor, soybean trade in 2021/22 trimmed slightly compared to July, mostly reflecting lower import forecast for China due to reduced crush margins and lower than earlier anticipated growth in the country’s hog industry.
Data
Other reports (July 2021)
1. AMIS market report
- Wheat: Trade in 2021/22 (July/June) to expand faster than earlier expected, following this month’s higher import forecasts for Algeria and Pakistan.
- Soybeans: Trade in 2021/22 (Oct/Sep) left unchanged m/m, confirming subdued y/y growth tied to a modest expansion in China’s import demand
- Rice: Trade in 2021 (January-December) raised marginally, with purchases (crossborder and seaborne) by Viet Nam now seen doubling over the year. Trade in 2022 still seen stagnating y/y
- Maize: Trade in 2021/22 (July/June) nearly unchanged m/m and forecast to rise marginally above the 2020/21 level.
2. FSP Excessive Food Price Variability Early Warning System
Click here for the full screen
Source: Commodity Price Variability Monthly Outlook (https://www.foodsecurityportal.org/tools/excessive-food-price-variability-early-warning-system)
Data documentation
Copyrights
IFPRI holds the copyright to the Food Trade Dependence Index in the Food Security Portal and but encourages duplication of these materials for noncommercial purposes. Proper citation is requested and prohibits modification of these materials. Permission to make digital or hard copies of part or all of this work for personal or classroom use is hereby granted without fee and without a formal request provided that copies are not made or distributed for profit or commercial advantage and that copies bear this notice and full citation on the first page. Copyright for components not owned by IFPRI must be honored and permission pursued with the owner of the information. To copy otherwise, to republish, to post on servers, or to redistribute to lists, requires prior specific permission.
Additional copyrights on primary data may still be applied depending on initial data provider.
Source
Source – Food Trade Dependence Index is computed based on Data from Trade Data Monitor (TDM), specifically Import Quantity data on a monthly basis.Date of download for Data from TDM is August 16th, 2021.
Commodity codes
HS codes for crops are:
1. Wheat and Meslin (1001)
2. Maize (1005)
3. Rice (1006)
4. Soybeans (1201)
Bangladesh Import Data for wheat, soybeans, maize, and rice are based on Export Data for 4 crops from countries to Bangladesh.
Egypt Import Data for wheat is based on Export Data for this crop from countries to Egypt.
Missing import quantity is computed using the import value for that month and average import price for that year. Missing import quantity is computed only when “trade value” of that month exceeds 3% of average Trade Value for the specific year.
3-month average for the food trade dependence index is average of June, May, April of 2021 import data.
Country Codes
CountryCode - ISO ALPHA-3 Code
CountryName - Country Name
Data download
You can download the data as CSV format or as API here: https://api.foodsecurityportal.org/dataset/food-trade-dependence-index1
Partners