Outline
- 01Summary
- 02Key Findings
- 03Interactive Charts
- 04PEM Dashboard
- 05Background & Reports
- 06Partners
Download report & Data

Last update: September 2024
The fight against hunger is not over yet. A fight against overweight and obesity must begin. Here you can find how patterns of malnutrition are evolving across the globe.
This webpage provides an abridged and interactive version of the study “Progress towards ending hunger and malnutrition: A cross-country cluster analysis “ published by FAO and IFPRI and undertaken in partnership with the Food and Nutrition Security Impact, Resilience, Sustainability and Transformation (FIRST) program. The FIRST program is a strategic partnership between FAO and the European Union (EU), whereby the EU is making an investment of nearly €8 billion in over 60 countries during the 2014–2020 period to improve food security and nutrition and promote sustainable agriculture. Additional funding support from the CGIAR Research Program on Policies, Institutions, and Markets (PIM) led by the International Food Policy Research Institute (IFPRI)
This report provides a quantitative assessment of progress made towards the sustainable development goal of ending hunger and all forms of malnutrition since 1990. Using a cluster analysis, it categorizes country performance along three dimensions: (1) food security and nutrition outcomes; (2) structural drivers of food security and nutrition; and (3) past and present policy interventions in support of food security and nutrition.
Key findings show that much progress has been made towards the goal of ending hunger. Yet, many countries continue to face moderate to high degrees of undernourishment, especially where economies made least progress in transiting towards high-productivity, modern agriculture and non-farm economic development and where policy stances have been weak in promoting agricultural development, reducing gender inequalities, and improving infrastructure and basic social services.
The decline in undernourishment has come with a rise in the prevalence in overweight and obesity. The spread of this form of malnutrition has come with dietary shifts towards the consumption of more animal-sourced and processed foods that have come with urbanization and income growth. By 2015, the vast majority of countries faced moderate to high prevalence of adult overweight, and this form of malnutrition is also on the rise in countries with still significant rates of child undernourishment. No country in the world is showing declines in the rate of adult overweight.
Key Findings
Food security and nutrition have greatly improved over the past 25 years, as reflected in sharp reductions in hunger and undernutrition in most parts of the world.
Far From Achieving The SDG
Yet, the world is still far from achieving the SDG of ending hunger and all forms of malnutrition. Moderate to high rates of hunger and/or child undernourishment still affect 53 countries.
Moderate To High Overweight
At the same time, moderate to high overweight among adults has become the most important nutrition concern in more than half of all countries in the world
Zero Hunger And Child Nutrition
Only two countries, the Republic of Korea and Japan, have achieved zero hunger and child nutrition while also keeping adult overweight and obesity to a minimum.
High-Productivity Agriculture And Advanced Industrial And Services
Countries that made the most progress in shifting to high-productivity agriculture and advanced industrial and services sectors also show the greatest reductions in hunger and child undernourishment.
Undernourishment Is Low
Undernourishment is low where governments supported agricultural growth through market support and investments in R&D, ensured (near) universal coverage of electricity, drinking water and sanitation, improved access to education for all and reduced gender gaps. It is high in countries which did not manage to undertake or sustain such policy efforts.
Future Food Policy Designs
Many of the policy efforts to address problems of undernourishment and child wasting and stunting also seem to induce (probably indirectly) higher rates of overweight. Future food policy designs should be aware of this trade-off.
Interactive Charts
The series of interactive charts provide a quantitative assessment of progress made towards the sustainable development goal of ending hunger and all forms of malnutrition since 1990. Using a cluster analysis, it categorizes country performance along three dimensions: (1) food security and nutrition outcomes; (2) structural drivers of food security and nutrition; and (3) past and present policy interventions in support of food security and nutrition.
Cluster analysis suggest countries can be classified into six types of food security and nutrition situations:
- Type 1: High hunger and high child undernutrition - Cluster of countries with high prevalence of undernourishment (median: 42 percent) and high rate of child stunting (median: 41 percent).
- Type 2: Moderate hunger but high child undernutrition - Cluster of countries with moderate prevalence of undernourishment (median: 27 percent) but high rate of child stunting (median: 45 percent).
- Type 3: Moderate hunger and moderate child undernutrition - Cluster of countries with moderate prevalence of both undernourishment (median: 20 percent) and child stunting (median: 35 percent).
- Type 4: Moderate child undernutrition and moderate adult overweight - Cluster of countries with moderate prevalence of both undernourishment and child stunting (medians: 14 percent and 23 percent respectively) and moderate prevalence of adult overweight (median: 43 percent).
- Type 5: Low child undernutrition and moderate adult overweight - Cluster of countries with low prevalence of undernourishment and child stunting (median: 5 percent for both) and moderate prevalence of adult overweight (median: 32 percent).
- Type 6: No hunger, but high adult overweight - Cluster of countries with no hunger (median: prevalence of 2 percent for both undernourishment and child stunting) but having high prevalence of adult overweight (median: 55 percent).
Detailed Observed Pathways From Undernourishment To Overweight, 1990-2015 (Fig 4)
Source: David Laborde, Abdullah Mamun, & Rob Vos, Progress towards Ending Hunger and Malnutrition, FAO and IFPRI, 2020.
We have here the detailed observed pathways by country and over time between 1990 and 2015. In a stylized path we can expect that countries tend to take a path over time that reduces the prevalence of undernourishment but increasing the prevalence of overweight. This is, of course, not the desired pathway, as one would hope to see countries move along the preferred path of reducing both the prevalence of undernourishment and the prevalence of overweight. Countries of type [3] and [4] especially tend to suffer from this double burden. At the country level, we also observe that many countries suffering from a double burden of malnutrition.
Stylized Pathways From Undernourishment To Overweight, 1990–2015 (Interactive Version Of Figures 3 And 5)
(Numbering Of Figures Below Refers To That Used In The Report)
Source: David Laborde, Abdullah Mamun, & Rob Vos, Progress towards Ending Hunger and Malnutrition, FAO and IFPRI, 2020.
Evolution Of Size Of FSN Clusters Over Time, 1990-2015 (Fig 2)
Source: David Laborde, Abdullah Mamun, & Rob Vos, Progress towards Ending Hunger and Malnutrition, FAO and IFPRI, 2020.
Most countries that moved out of Types 1 and 2 since 1990 belonged to Type 3 In 2015, as both hunger and child stunting had fallen to moderate levels. This type expanded from 17 countries in 1990 to 28 countries in 2015.
Adult overweight and obesity had risen to notable levels in 10 countries by 2015, accompanied by moderate levels of child stunting. The double burden of malnutrition is heaviest in this type. The number of countries in this type reached a high of 25 in 2000; since, it has shrunk, as many countries moved from Type 4 to Type 5.
This country grouping, having moderate adult overweight but low or no hunger and child undernutrition, is rather heterogeneous. It includes both middle-income economies that by and large have managed to resolve their undernourishment problem but are seeing a rising overweight problem. Only two economies in this type – and in fact in the entire country sample – managed to contain increases in the prevalence of adult overweight (i.e., Japan and the Republic of Korea).
The last cluster contains most of the advanced economies, as well as a large portion of the countries in Latin America, the Middle East and Northern Africa, and Central Asia. By 2015, this type has grown most in size, increasing from 43 to 79 countries between 1990 and 2015. Thus, most countries in this group have reached low to zero undernourishment but are now facing high prevalence of overweight and obesity as their major malnutrition and health problem.
In 2015, there were 8 countries (most in East and Central Africa) with both a high prevalence of undernourishment and a high rate of child stunting, down from 23 countries in 1990.
In 2015, 7 countries (including India, Yemen and several countries in central and eastern Africa) still faced high hunger but had reduced child undernutrition to moderate levels. This group also has shrunk considerably in size, as it consisted of 20 countries in 1990.
Food Security And Nutrition Clusters (Map)
Source: David Laborde, Abdullah Mamun, & Rob Vos, Progress towards Ending Hunger and Malnutrition, FAO and IFPRI, 2020.
Map source: United Nations [United Nations Office for the Coordination of Humanitarian Affairs] map. 7 May 2020
Map disclaimer: The boundaries and names shown and the designations used on this map do not imply official endorsement or acceptance by the International Food Policy Research Institute. (IFPRI).
Changes In The Prevalence Of Undernourishment And Adult Overweight Between 1995 And 2015 By FSN Cluster (Fig 6) (Changes In Percentage Points)
Source: David Laborde, Abdullah Mamun, & Rob Vos, Progress towards Ending Hunger and Malnutrition, FAO and IFPRI, 2020.
The above figure shows the trajectory of the prevalence of undernourishment and of adult overweight over the past 20 years.
Most countries belonging to Types 1 and 2 in 1995 managed to reduce the prevalence of undernourishment, though to varying degrees, without much increase in the prevalence of overweight; only North Korea, Zambia, and Tajikistan witnessed a rise in the prevalence of undernourishment.
Countries with moderate adult overweight and child undernutrition (Type 4) in 1995, generally managed to reduce undernourishment, subsequently. However, they also witnessed steep rises in the prevalence of overweight and, as a result, moved either into Type 5 or Type 6. Likewise, most countries that were in Type 5 in 1995 saw significant increases in the rate of adult overweight.
Very few countries belonging to Type 6 in 1995, having already high rates of adult overweight, managed to prevent further increases. In fact, most faced increases in the prevalence of overweight by 10 percentage points or more.
Structural Conditions Clusters (Maps)
Source: David Laborde, Abdullah Mamun, & Rob Vos, Progress towards Ending Hunger and Malnutrition, FAO and IFPRI, 2020.
Map source: United Nations [United Nations Office for the Coordination of Humanitarian Affairs] map. 7 May 2020
Map disclaimer: The boundaries and names shown and the designations used on this map do not imply official endorsement or acceptance by the International Food Policy Research Institute. (IFPRI).
The above figure shows the trajectory of the prevalence of undernourishment and of adult overweight over the past 20 years.
Most countries belonging to Types 1 and 2 in 1995 managed to reduce the prevalence of undernourishment, though to varying degrees, without much increase in the prevalence of overweight; only North Korea, Zambia, and Tajikistan witnessed a rise in the prevalence of undernourishment.
Countries with moderate adult overweight and child undernutrition (Type 4) in 1995, generally managed to reduce undernourishment, subsequently. However, they also witnessed steep rises in the prevalence of overweight and, as a result, moved either into Type 5 or Type 6. Likewise, most countries that were in Type 5 in 1995 saw significant increases in the rate of adult overweight.
Very few countries belonging to Type 6 in 1995, having already high rates of adult overweight, managed to prevent further increases. In fact, most faced increases in the prevalence of overweight by 10 percentage points or more.
Structural Clusters
Five country types, representing a variation on the phases of the agricultural transformation typology
Type A is mainly composed of advanced economies, which have passed the demographic transition to very low birth rates, have a low share of agricultural GDP, and have very high levels of agricultural land and labor productivity. Their institutions are strong, as reflected in low levels of the indicators for corruption and political instability.
Type B consists of slightly less-advanced economies, with relatively low dependence on agriculture and with improved food availability achieved through agricultural intensification and productivity growth. The quality of institutions is moderate.
Type C consists of countries with relative land abundance and high dependence on natural resources, including in metals and minerals. Non-agricultural commodity dependence defines much of the wealth and structural transformation in these economies. Corruption tends to be high, but fiscal space created by natural resource wealth appears to support relative political stability.
Type D, in contrast, consists of countries facing land scarcity, but having generally better agro-ecological conditions and trading options than Type E.
Type E is largely composed of low-income landlocked countries with still some potential for agricultural development at the extensive margin but constrained by relatively poor agro-ecological conditions and high transaction cost to trade.
Evolution Of The Number Of Countries Per Cluster Of Structural Conditions (Fig 7)
Source: David Laborde, Abdullah Mamun, & Rob Vos, Progress towards Ending Hunger and Malnutrition, FAO and IFPRI, 2020.
While defined as structural variables, the related conditions are not static and do change over time. Accordingly, countries have shifted from one cluster to the next depending on the processes of structural transformation. Changes in the composition of the clusters over time are shown
Several structural features are foremost time invariant, such as landlocked status or biophysical agricultural potential.11 Most other variables, however, are time variant, being linked to demographic transitions, economic diversification, improvement or deterioration of institutions, and conflicts.
This clearly shows that the number of rural economies (clusters D and E) has fallen significantly (by one third) between 1995 and 2015. This has happened at different speeds varying by country. Unsurprisingly, the decline has been rapid among the rural economies with a good agricultural potential for intensification and potential for trade (type D), which has facilitated economic diversification, including through export-oriented strategies.
Fewer countries have moved out of Type E, which consists of landlocked countries with poor agricultural potential and weak integration into regional and global value chains. Among countries moving out of Type E, a few have progressed towards Type C, but most have become part of Type B.
Changes In The Prevalence Of Undernourishment And Adult Overweight Between 1995 And 2015 By Structural Conditions (Fig 8)
Source: David Laborde, Abdullah Mamun, & Rob Vos, Progress towards Ending Hunger and Malnutrition, FAO and IFPRI, 2020.
The above figure shows the change in the prevalence of undernourishment and that in adult overweight between 1995 and 2015 by countries and their cluster position in 1995.
As expected, it shows that the more advanced and transforming countries (Types A and B) tended to show increases in the prevalence of adult overweight, while maintaining low to zero rates of hunger and undernutrition. For the other structural clusters (C, D, and E), the figure shows a rather dispersed pattern of rates of reduction in undernutrition and increase in adult overweight, which could suggest that the impact of structural conditions is strongly mediated through policy.
In the policy space six groups can be described as follows:
Type [α] includes many large agricultural exporters (both among developed and developing countries in 2015) who’s policies have been characterized by moderate public support and low tariffs. It is the level of protection of the agricultural sector that differentiates this group from the next.
Type [γ] which has much higher tariffs and is currently (2015) comprised of several large middle-income countries, like India, Bangladesh, and Mexico.
Type [β] also shows – on average – a slightly higher degree of agricultural protection than Type [α], but countries in this type provided much stronger support to the agricultural sector through public spending allocations and investments in rural infrastructure, rather than through tariff protection.
Type [κ] includes countries where agriculture is heavily subsidized, such as in Japan, the Republic of Korea and some European countries.
Type [δ] includes countries with relatively high tariffs on agricultural products but which provide limited farm support and already have broad, though still incomplete coverage of rural infrastructure. Gender disparity was still great in this cluster.
Type [ω] includes most sub-Sahara African countries and least developed countries in Asia, such as Afghanistan. They are more protectionist than average, have invested relatively little in agriculture, have insufficient rural infrastructure, and still have large gender disparity.
Evolution Of The Size Of Policy Clusters Between 1990 And 2015 (Fig 9)
Source: David Laborde, Abdullah Mamun, & Rob Vos, Progress towards Ending Hunger and Malnutrition, FAO and IFPRI, 2020.
Above we see shifts in the size of the clusters, reflecting significant shifts in policy stances by countries over time. Mostly, shifts have been from Type [γ] to Type [α], reflecting significant lowering of tariffs on agricultural products. Seventeen countries made this shift over the past 25 years.
A second set of countries (14) increased farm support (both subsidies and import tariffs) and stepped up public investment in rural infrastructure, thus moving into Type [β]. A smaller number of countries (10) moved from cluster [γ] to [β], as they invested further in rural infrastructure, increased direct support to farmers, but reduced agricultural protection. Seven countries shifted from Type [δ] to Type [γ] after partially liberalizing agricultural trade, while eight countries increased protection and shifted from Type [α] to Type [γ].
Policy Clusters (Maps)
Source: David Laborde, Abdullah Mamun, & Rob Vos, Progress towards Ending Hunger and Malnutrition, FAO and IFPRI, 2020.
Map source: United Nations [United Nations Office for the Coordination of Humanitarian Affairs] map. 7 May 2020
Map disclaimer: The boundaries and names shown and the designations used on this map do not imply official endorsement or acceptance by the International Food Policy Research Institute. (IFPRI).
Policy Stance And FSN Performance Over Time, 1990-2015 (Fig 10)
Source: David Laborde, Abdullah Mamun, & Rob Vos, Progress towards Ending Hunger and Malnutrition, FAO and IFPRI, 2020.
Figure above shows a simple comparison for all countries between the prevalence of undernourishment and the prevalence of overweight, on the one hand, and the FSN policy stance (and changes therein), on the other. It clearly shows that – though also making progress – the countries in policy cluster [ω] and to a lesser extent those in Groups [δ] and [κ] continue to have highest levels of undernourishment. Policy cluster [ω] has low investment in rural infrastructure, limited direct farm support, average protection of agriculture and wide gender disparities.
Good performers in terms of lower rates of undernutrition have followed both more and less protective agricultural trade policies, though all have good to very good infrastructure and greater gender parity. The policy typology is mostly relevant to identify efforts at reducing food energy deficits (hunger) and child undernutrition, as we lack identifiers for policy efforts directed at reducing overweight and obesity.
PEM Dashboard
The Progress towards Ending Malnutrition (PEM) Dashboard was created by David Laborde, Abdullah Mamun, and Rob Vos of the International Food Policy Research Institute (IFPRI).
It provides the database for the study: “Progress towards ending hunger and malnutrition: A cross-country cluster analysis” written by David Laborde, Abdullah Mamun, and Rob Vos of IFPRI, with contributions by Marco Knowles, Karel Callens and Panagiotis Karfakis of the Food and Agriculture Organization of the United Nations (FAO).
This study was undertaken in partnership with the Food and Nutrition Security Impact, Resilience, Sustainability and Transformation (FIRST) program of the FAO and the CGIAR Research Program on Policies, Institutions, and Markets (PIM) led by IFPRI. The FIRST program is a strategic partnership between FAO and the European Union (EU), whereby the EU is making an investment of nearly €8 billion in over 60 countries during the 2014–2020 period to improve food security and nutrition and promote sustainable agriculture.
Funding support for the development of the dashboard and the preparation of the study was provided by FAO (through the EU-funded FIRST program) and CGIAR’s PIM program. The creators of the dashboard are solely responsible for the data as presented in the dashboard. Any errors cannot be attributed to the EU, FAO, PIM, IFPRI, or CGIAR.
Map source: United Nations [United Nations Office for the Coordination of Humanitarian Affairs] map. 7 May 2020
Map disclaimer: The boundaries and names shown and the designations used on this map do not imply official endorsement or acceptance by the International Food Policy Research Institute. (IFPRI).
Background & Reports
The International Food Policy Research Institute (IFPRI) joined forces with the Food and nutrition security Impact, Resilience, Sustainability and Transformation (FIRST) Programme, a strategic partnership between the European Union (EU) and the Food and Agriculture Organization of the United Nations (FAO). Together, they have developed a global quantitative analysis, covering food security and nutrition policies and outcomes in 165 countries during the 1990-2015 period. This work is reflected in the paper Progress towards ending hunger and malnutrition: a cross-country cluster analysis and all the data can be explored here.
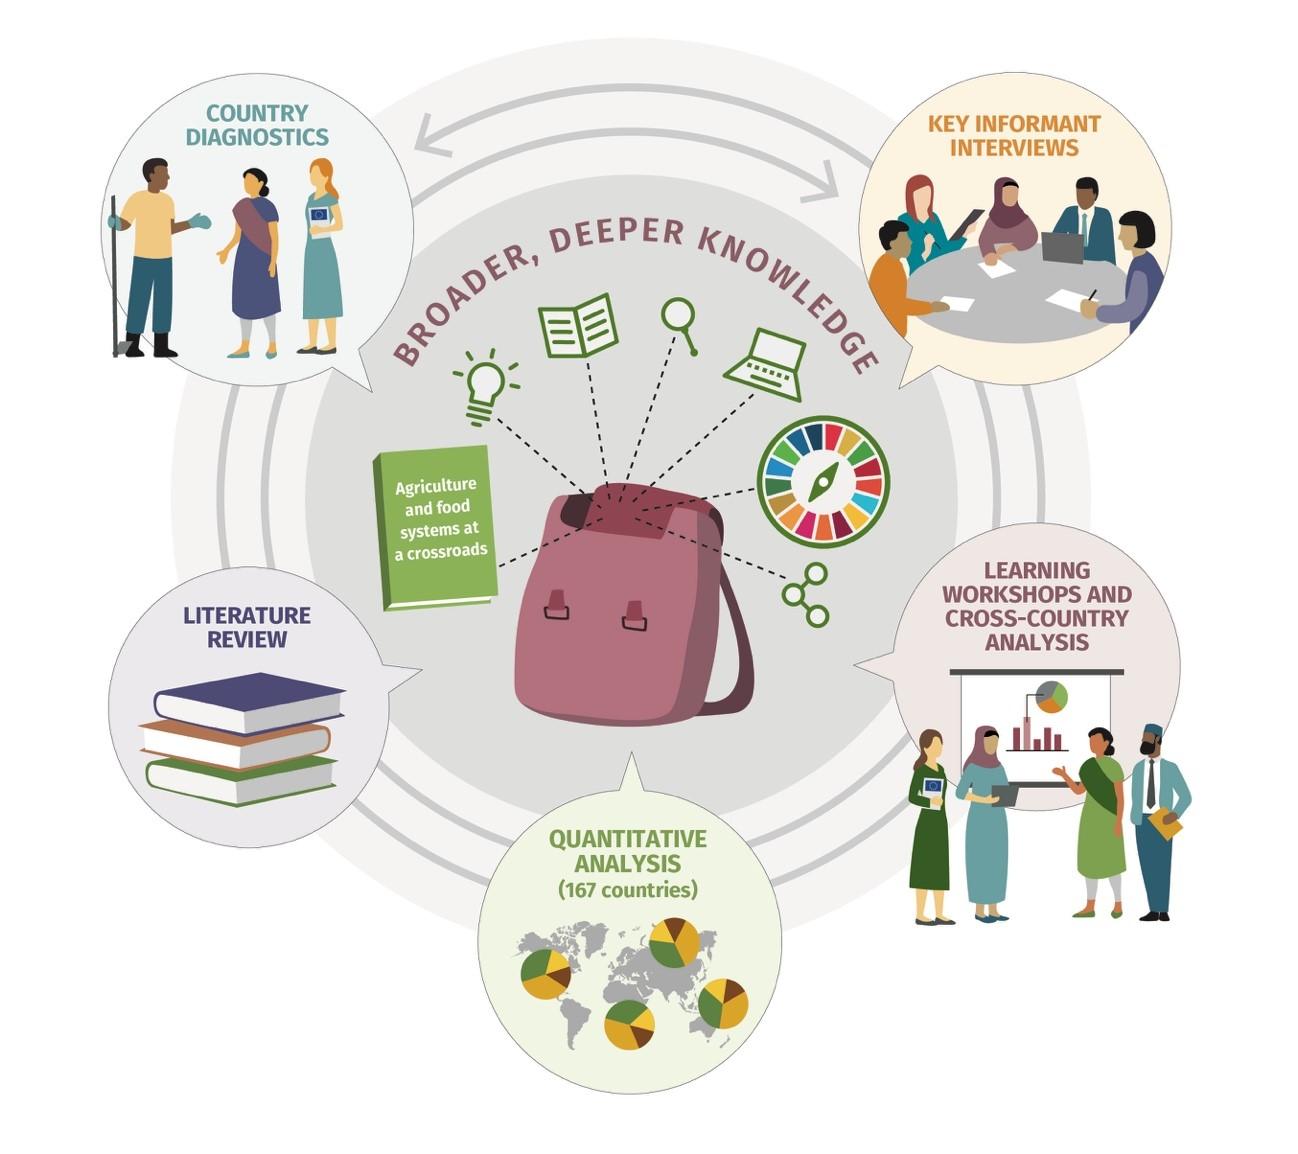
Such a comprehensive quantitative analysis fits into a broader stocktaking exercise carried out by FIRST to map and assess the effectiveness of food security and nutrition policies, review the existing scientific literature, consult stakeholders and build consensus around a set of top priorities for immediate policy action and financial commitment towards achieving Sustainable Development Goal 2 (SDG2).
FIRST carried out a series of consultative country-driven policy effectiveness analyses, which covered 27 countries, one territory and a sub-regional economic organization. These countries are mainly low-income and lower-middle income countries from Asia and the Pacific, Sub-Saharan Africa and Latin America. Some of them suffer from protracted crisis or post conflict challenges. Together with the quantitative analysis, these policy effectiveness assessments serve as the primary source of information for the stocktaking exercise. Led and facilitated by the FIRST policy officers, they included a systematic reflection and in-country dialogues with different stakeholders in order to inform upcoming decisions on national and budget priorities regarding food security and nutrition objectives.
In parallel, a vast literature review and interviews with key informants were also carried out together with Sight and Life, Society for International Development.
All these different streams of knowledge fed into a consultative knowledge generation lab for accelerating progress towards the Zero Hunger targets of SDG2 and have also fed into the paper Agriculture and food systems at a crossroads: lessons learnt from a cross-country analysis by the FIRST Programme.
A Series Of Consultative Country-Driven Policy Effectiveness Analyses
*Map source: United Nations [United Nations Office for the Coordination of Humanitarian Affairs] map. 7 May 2020
*Map disclaimer: The boundaries and names shown and the designations used on this map do not imply official endorsement or acceptance by the International Food Policy Research Institute. (IFPRI).
Direct links to the consultative country-driven policy effectiveness analyses
Partners
The dashboard and preparation of the study was funded by the FIRST programme, a partnership of the Food and Agriculture Organization of the United Nations and the European Union, and additional funding support from the CGIAR Research Program on Policies, Institutions, and Markets (PIM) led by the International Food Policy Research Institute (IFPRI). The FIRST programme provides policy assistance to governments of over 23 countries to create an enabling environment for food security, nutrition and sustainable agriculture. The contents of this page and the study are the sole responsibility of the authors and do not necessarily reflect the views of the EU, FAO, CGIAR or IFPRI.
FOOD AND AGRICULTURE ORGANIZATION OF THE UNITED NATIONS

EUROPEAN UNION
INTERNATIONAL FOOD POLICY RESEARCH INSTITUTE