Food Security Portal
Facilitated by IFPRI
Food Price Watch
The FSP’s Vulnerability to Global Market Shocks V.2: Price Shocks to Major Staple Foods provides new metrics quantifying country-level vulnerability to changes in international prices for major staple crops.

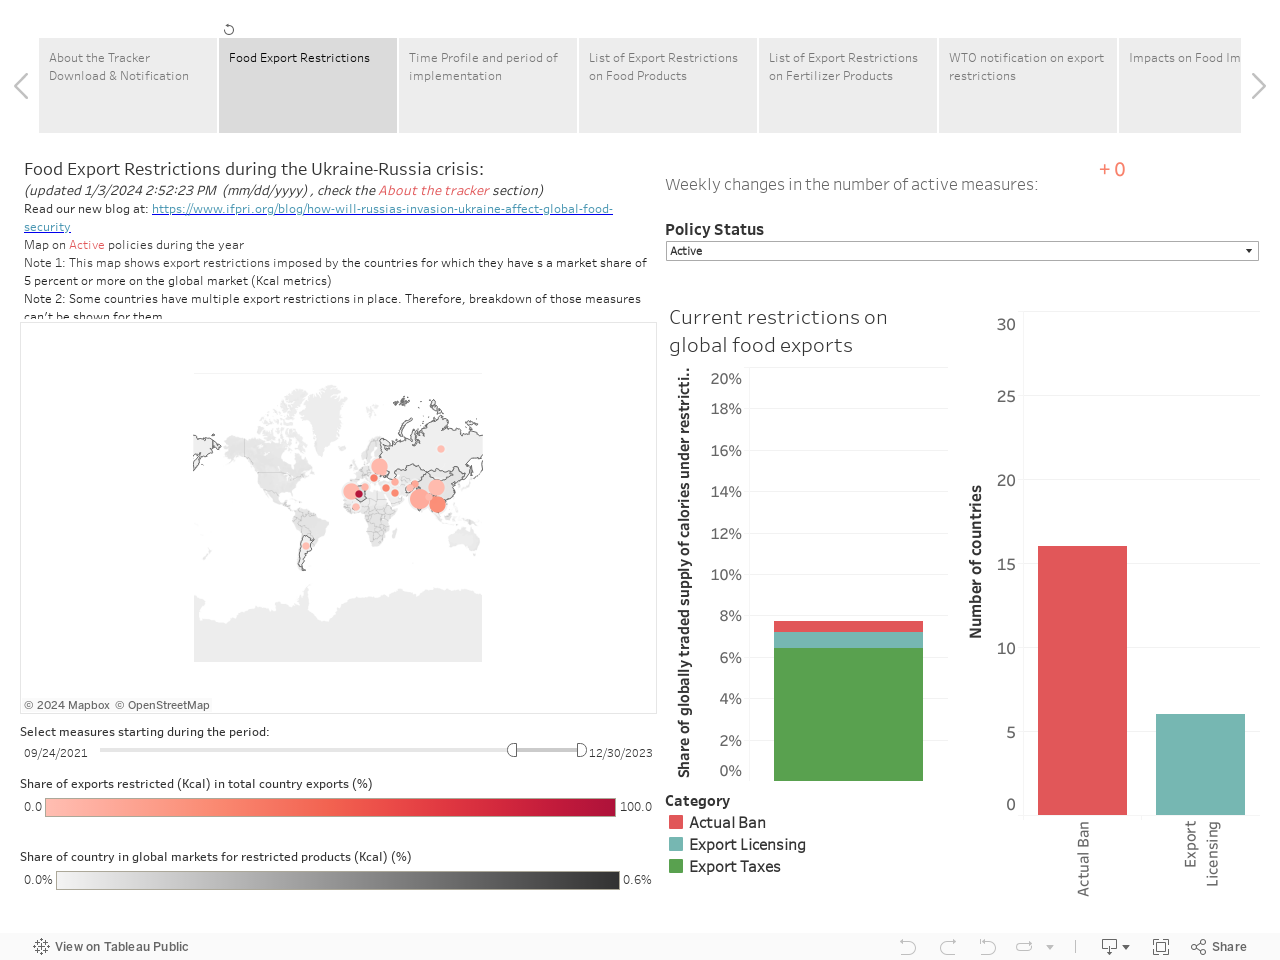
Food and Fertilizer Export Restrictions Tracker
Our export restriction tracker continues monitoring food and fertilizer trade policies by the countries. According to our food and fertilizer export restriction tracker, no new measures were announced by any country in February 2024. The share of traded calories that are restricted due to export restrictions remains the same as in the previous month. The next update will be on April 8, 2024.
Click here for the full screen
Click here for the full screen
Your Feedback Is Appreciated
Sign up to Our Newsletters
THE FSP E-LEARNING PLATFORM